Simple tips for recording data in spreadsheets
Especially if you want ME to analyze them.
Laugh’s over…back to reality.
In the world we actually live in, clinical researchers often need to collect and manage data themselves. This will typically involve entering information into a spreadsheet. Yet very few researchers are trained to do this properly, despite how often they need to do it, or the critical importance of data quality. So let's remedy that now.
Before we get into the details, let's declare two overarching goals. The first is that we collect and manage data in a manner that avoids data errors. The second is that we do things in a way that facilitates the analysis of the data and the reporting of results. This latter point is even more important if someone else, like a statistician, will be doing the analysis.
To meet these objectives, just follow these simple rules:
Data should be arranged in a rectangular matrix with rows and columns
Medical research data should be collected using a matrix structure with rows and columns. Each row in this matrix should reflect a single observation, which is usually a research participant (e.g. a patient). The columns should then reflect the characteristics of those participants (i.e the variables).
That's it. No blank columns. No blank rows. No need to satisfy your creative spirit. A matrix where every row is an observation and every column is a variable. No exceptions!
Columns should only include one type of information
Information is almost always recorded as a number, as text (which might include some combination of letters, spaces, symbols, and numerals), or as a date. Each column should only contain one of these types of information. Further, all the entries in the same column should share the exact same format, scale or unit of measurement.
If you find yourself needing to break this rule, try adding another column.
Columns should be given short but informative variable names
The first row of your spreadsheet should contain the column names. These should be short, perhaps no more than 8-12 characters. If some columns should be naturally grouped, like multiple items recorded for a single instrument, or at a shared time point, you can add a consistently formatted prefix or suffix, separated from the main variable name with an underscore.
Missing values
When a value is missing, just leave it blank. And certainly never-ever-ever reflect missing data with a 9, 99, 999, etc. However, it can be important to explain why a value is missing, so add another column for that info.
Constraints should be used to prevent entering the wrong type of data
Humans make mistakes. We want to minimize those. Many data collection tools you might use, including Excel and Google Sheets will have ways to limit the kinds of values you can enter into your dataset. You must use these.
Some examples:
Variables that should be numbers should only allow you to enter numbers. Further, there should be a rule that contains the range of numbers you can enter.
Categorical variables that are recorded with text should only allow you to enter predefined text for each category.
Variables reflecting dates and times should only allow you to enter those using the exact same format. Again, some constraint on the range of acceptable dates or times can be helpful.
Using these rules not only helps avoid data errors, they greatly reduce the time needed to verify and “clean” data. They also help enforce the rule above about only including a single kind of information in any one column.
Create another matrix with additional information about the variables
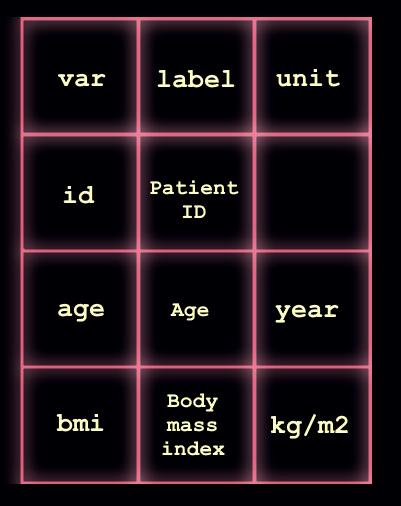
Now you want to create a second dataset that is about your dataset. The same rules from above apply, but now each row will reflect one of your variables, and each column will be some information about those variables. These would usually include, at the minimum, a column with more detailed labels explaining exactly what the variables are, and a column of units (where applicable).
Multiple datasets
Sometimes it's helpful to use more than one spreadsheet to record your data. That's ok. Just make sure to use the same rules as above, and that each spreadsheet has a column (or distinct combination of columns) that uniquely identifies the observations in both spreadsheets that need to be linked.
Don’t include calculations in your spreadsheet
Once the data are collected you will often want to make some calculations based on them. For example, if you collected the heights and weights of patients, you might want then calculate their BMIs. Or you might want to otherwise manipulate the data, like creating a new smaller dataset that only includes certain types of research participants. However, you want to treat the research dataset you spent so much effort on like it’s sacred. This means that when we want to do stuff to data, we want to do it safely so we don’t accidentally change them. This in turn means doing any and all manipulations separately from the “raw” data (always using a completely reproducible, scripted approach, regardless of the software you use). Plus I have to double check your calculations anyway. So keep your grubby, error-prone fingers out of the data!
Colors, highlighting, notes, etc.
I accept that sometimes having a bunch of colors in your spreadsheet can help with data entry by keeping things visually organized. That's ok. Just know that these visual cues and any little notes should never ever be used to convey any information that might be used in the analysis of those data.
Avoid free text
Avoid free text because it is unlikely to analyzed, unless YOU have the expertise to analyze them. That's because otherwise you or some other poor sod will have to find some way to categorize all the responses or otherwise extract what's vital. It's much better to do that work in advance, and ask better questions that result in structured responses.
“Long” Vs “Wide”
Sometimes you will have multiple observations of the same research participant. For example, a patient enrolled in a clinical trial might have their blood pressure measured at baseline, then again 3 months later (+3), and again another 3 months after that (+6). Data like this can be structured as long or wide. In this example, long means that you have a row for each patient at each time (3 rows per patient), and one column for the blood pressure measurements. Wide means you have 1 row per patient, but a separate column for each of the three blood pressure measurements.
Should you always choose one of these over the other? I personally find the long format preferable and would encourage researchers to favour it, but at the end of the day it’s easy enough to flip back and forth between these as needed if you know what you are doing, so it’s not a deal breaker.
And what happens if you ignore these tips?
Other resources
Data Organization in Spreadsheets (Karl W. Broman & Kara H. Woo)
Sending me data in Excel (Kristian Brock)
Tips for data entry in Excel (Crystal Lewis)
Organize Excel Data before giving it to a Statistician (Piktochart)
Long vs Wide formats (Stef van Buuren)
How to export analysis-ready survey data (Crystal Lewis)
Please feel free to suggest others.


Clear and practical advice - as always!
Could you please explain the reasons for not using 9, 99 etc. to represent missing values?
I remember reading somewhere that it is best not to leave any blanks. There’s no way of knowing whether a cell was left blank intentionally (missing data) or accidentally (data entry error). Maybe your recommendation to have a column to record the reason for the missing value will solve this problem.